Global Energy Statistics
Background
Global energy systems are a critical part of today’s discourse regarding climate change and economy. The chosen dataset contains important indicators of each country’s energy system, denoted by its respective column headers. Nations with high coal, petroleum or gas production and CO2 emissions raise questions about the sustainability of their practices, with high emissions severely impacting our environment and those resources being non-renewable. This project will investigate top emitters, efficiency and an emission breakdown to gain further insight.
Dataset
This project uses datasets from Kaggle, provided by Kushagra Arya called the CIA Global Statistical Database. This dataset is sourced from the CIA World Factbook 2024-2025.
Questions
This project asks:
- What are the top 10 countries that account for the most emissions for the year 2024-25
- Which are the top 10 countries with the highest emissions per capita
- Which countries generate the most electricity capacity per unit of CO₂ emissions?
- Which countries generate more electricity per person while keeping emissions per capita lower?
Findings
Question 1: What are the top 10 countries that account for the most emissions for the year 2024-25?
country <chr> |
emissions_tons <dbl> |
|---|---|
| CHINA | 11535200000 |
| UNITED STATES | 5006000000 |
| INDIA | 2314738000 |
| RUSSIA | 1985000000 |
| JAPAN | 1135887000 |
| GERMANY | 726881000 |
| KOREA, SOUTH | 686000000 |
| IRAN | 646000000 |
| CANADA | 612000000 |
| SAUDI ARABIA | 579000000 |
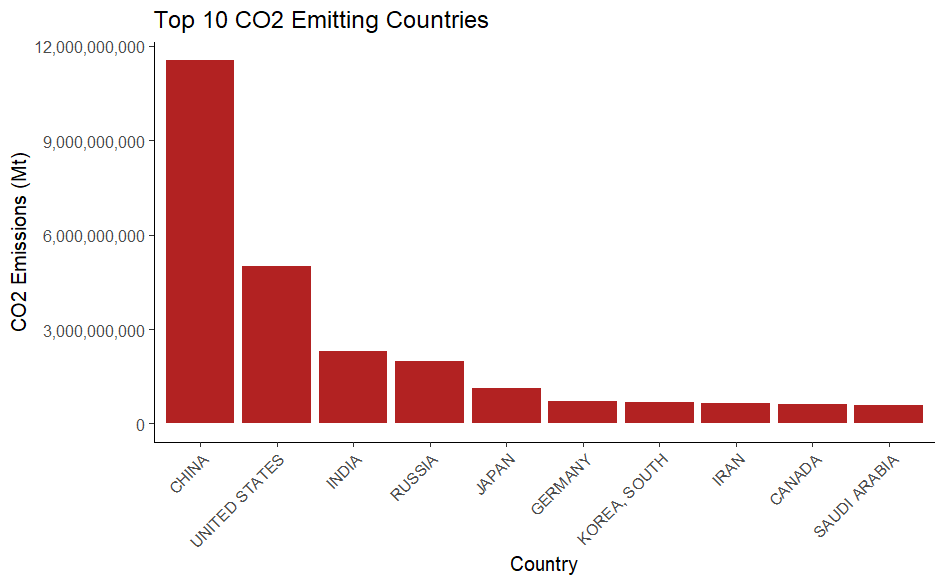
According to data from the CIA World Factbook, for the most recent year entered 2024-2025, China tops the world for emissions at over 11 billion tons. This is nearly 35% of the entire world’s emissions.The reasons for this lead are likely to do with China’s reliance on coal for generating energy, which is the most carbon-intensive fossil fuel. They also have the highest population in the world, and hold a major presence globally as a manufacturing hub, of which emissions emerge as a byproduct of industrial manufacturing. India, Russia, Japan and South Korea make up the other 5 Asian countries in the top 10.
The United States in second place is less than half that figure, coming in at over 5 billion tons. This is similar to China, where due to the scale of the US economy and their manufacturing, they produce a lot of emissions. Canada also represents the American continent at 9th. Germany is the only country in Europe on the list, being the biggest economy in Europe. Their steel and automobile manufacturing industries also consume a lot of energy. Europe is considered a global pioneer in renewable, clean energy, hence why other industrialized European countries are not on the list.
Lastly, in the middle east, Iran are interestingly one of three countries to have not agreed on the Paris Agreement, limiting international pressure on them to reduce emissions. Their rapid urbanization and reliance on oil and gas (fossil fuels) brings them to 8th. Saudi Arabia is the world’s top oil exporter and producer of natural gas. Their economic structure built around refining and construction contributes greatly to their high emissions.
Question 2: Which are the top 10 countries with the highest emissions per capita?
country <chr> |
population <dbl> |
emissions_per_capita <dbl> |
|---|---|---|
| QATAR | 2532104 | 43.83706 |
| SINGAPORE | 5975383 | 39.83008 |
| KUWAIT | 3103580 | 29.64319 |
| TRINIDAD AND TOBAGO | 1407460 | 27.70949 |
| UNITED ARAB EMIRATES | 9973449 | 27.67348 |
| BAHRAIN | 1553886 | 27.67256 |
| OMAN | 3833465 | 19.82541 |
| MALTA | 467138 | 19.26626 |
| TURKMENISTAN | 5690818 | 19.15366 |
| VIRGIN ISLANDS | 104917 | 19.06269 |
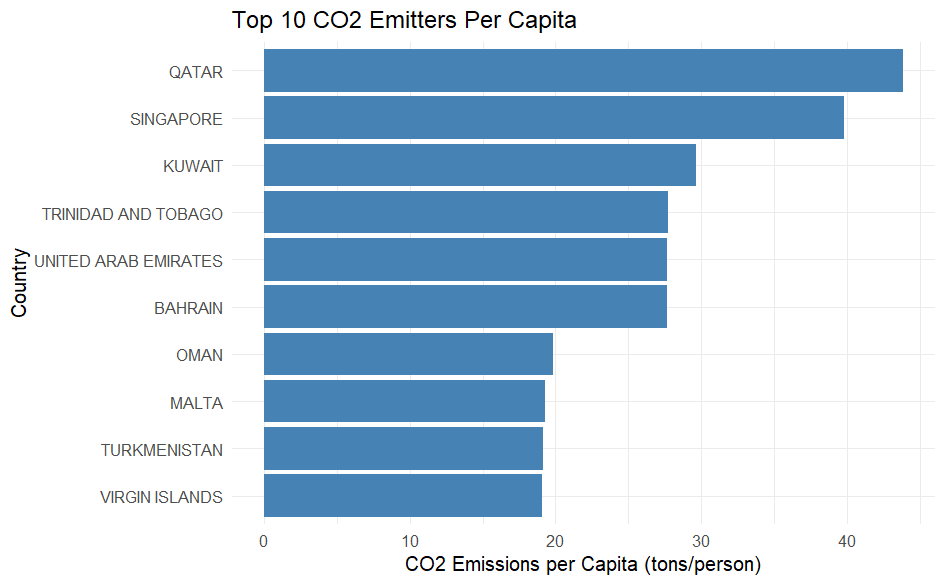
Emissions per capita represents emissions per person, hence removing discrepancies such as countries having higher populations. High scores typically represent nations with smaller populations that have proportionally high energy use. This can however lead to high statistics for countries that do not have high emissions. For example, Virgin Islands is given a high per-capita score due to their population of just 100,000.
Qatar, with a population of 2.5 million, holds top spot. Despite them having relatively low total emissions, their low population as well as their status as one of the world’s largest gas producers and exporters gives them a proportionally high per-capita figure. Their petrochemical industry is also proportionally large compared to their population.
Per Capita visualization map
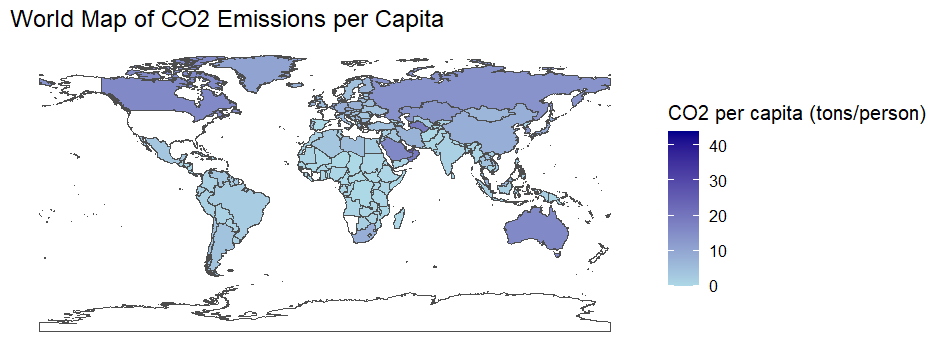
The Middle East, Asia and North America have comparatively darker shades of blue opposed to Africa and Europe. This can be explained by the high industrialization and urbanization of these regions. Asian countries like China and India also rely heavily on coal and natural gas, being carbon intensive fuels. Asia is also the world’s manufacturing hub. The Middle East has many energy-intensive refining industries, and their economies are based around fossil fuel exports, and North America has very large agricultural and industrial sectors. All these factors lead to higher emissions figures.
Europe is leading the world in renewable energy sources, while also not having manufacturing industries on the scale of the other continents. Lastly, the African region has lower GDP and industrialization rates, leading to them having comparatively low emissions figures.
Question 3: Which countries generate the most electricity capacity per unit of CO₂ emissions?
country <chr> |
capacity_per_emission <dbl> |
|---|---|
| BHUTAN | 2.4989293 |
| CONGO, DEMOCRATIC REPUBLIC OF THE | 1.4595000 |
| PARAGUAY | 1.2615714 |
| DOMINICAN REPUBLIC | 1.1510000 |
| NORWAY | 1.0655556 |
| TAJIKISTAN | 1.0162857 |
| ICELAND | 0.9890000 |
| SWEDEN | 0.9062292 |
| URUGUAY | 0.8913333 |
| ALBANIA | 0.8436667 |
A factor in common for all of these countries is their lack of reliance on fossil fuels. Paraguay is home to the Itaipu Dam, leading to almost 100% of their energy coming from hydro power. The DR of Congo is similar with the Inga Dam, as well as low industrialization. Norway, Sweden, Albania, Tajikistan and Iceland all also have hydroelectric infrastructure, and alongside their use of geothermal energy, their emissions are comparatively low for developed countries.
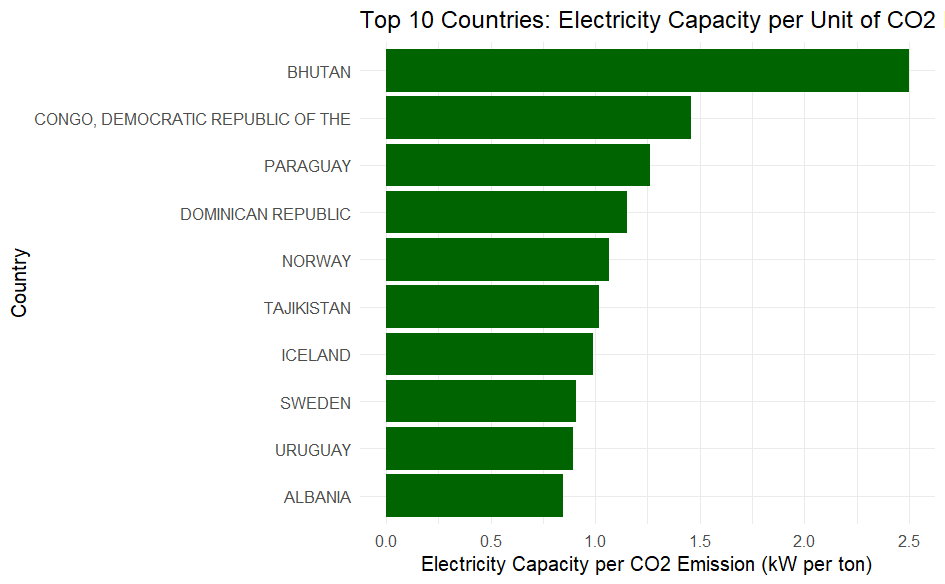
Notably, the regions of these countries vary with those who emit the most. This list is dominated by European and South American countries, while the list regarding top emitters was dominated by North America, Asia and The Middle East.
Question 4: Which countries generate more electricity per person while keeping emissions per capita lower?
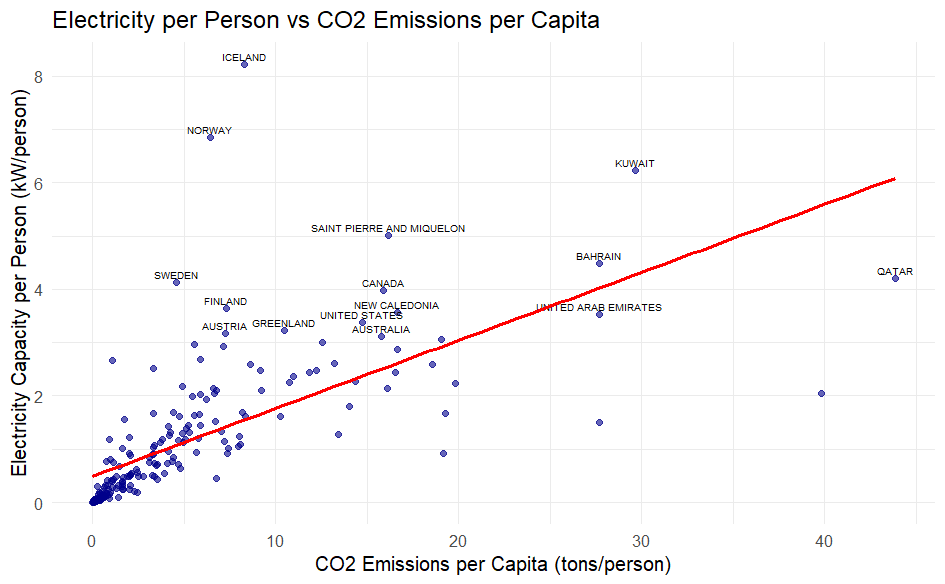 Graph Interpretation:
Top‑left quadrant: Countries in this quadrant generate a lot of electricity per person but keep emissions per capita relatively low. These are “efficient” or “cleaner” producers. Norway and Iceland are two examples.
Top-right quadrant: Countries in this quadrant generate a lot of electricity per person AND have high emissions per capita. These are energy intensive economies with high demand, but also hold high reliance on fossil fuels. Kuwait and Bahrain are two examples.
Bottom-right quadrant: Countries in this quadrant have high emissions per capita but relatively low electricity capacity. These are countries that burn a lot of fossil fuels, but doesn’t translate into an abundant amount of energy for the population. Qatar and Singapore are two examples.
Saint Pierre and Miquelon and New Caledonia show up as they have low populations, but large electricity structure. Islands and territories hold energy infrastructure differently compared to mainland countries. They are more or less standalone systems, and require a lot of backup infrastructure as they often do not have neighbouring energy grids. Tourism also changes energy needs drastically, depending on the seasons. Therefore during certain parts of the year, these islands need vastly more electricity capacity, but temporarily. Hence why these two nations have oversized energy infrastructure, when compared to their small populations.
Summary
There are many factors that play roles in determining a countries’ emission levels. Developing countries, such as much of Africa, do not hold a high stake in emissions as they lack the infrastructure necessary. Newly developed countries like much of Asia and the Middle East are still heavily reliant on fossil fuels to provide energy for their rapidly growing manufacturing industries, therefore contributing heavily to worldwide emissions. Developed countries that have had time to develop strategies regarding greener energy, like much of Europe, have set the blueprint for a greener future by allowing renewable energies to phase out fossil fuels and hence lowering emissions greatly. It is encouraged but remains to be seen how renewable sources can scale up to higher populations like China, India and the USA, as well as overcoming geographical challenges to develop the required infrastructure.
It is however, clear to see the impact of renewable energy sources on emissions figures.